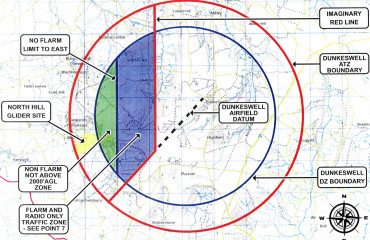
Weather and RASP hjgjhghj jhgkhhk tyuytiy hggjhggjghjgjhgjhgjhgjhgjhgjhgjhgjhgjhgjhgjhgjhgj hjhgjhgjhgjhgjhgjhgjhgjhgjhgjhgjhgjhgjhgjhgjhgjg Here is the RASP data for today and tomorrow, and below the Surface Pressure Chart along with links to other Weather resources… Today's RASP Forecast for North Hill Tomorrow's RASP Forecast for North Hill Met Office Surface Pressure Chart Today’s Surface Pressure Chart Links to other Weather Resources MET OFFICE WINDY.COM Lazy RASP RASP (Stratus) RASP Home page North Hill Weather Station North Hill Weather Station Rainfall Records Year Jan Feb Mar Apr May Jun Jul Aug Sep Oct Nov Dec Total 2013 - - - - - 31.8 24.2 43.0 59.4 - 58.0 94.4 951.4 2014 206.8 169.4 48.2 88.2 87.0 92.0 39.2 105.2 8.6 - - - - 2015 90.0 61.8 59.0 20.8 72.2 29.6 103.6 205.4 52.8 78.0 86.8 96.0 956.0 2016 51.8 0.0 53.0 27.2 39.0 93.0 14.8 51.8 78.2 43.8 144.8 29.4 626.8 2017 75.4 75.0 85.6 33.4 72.4 56.6 96.2 98.2 93.6 41.2 53.2 95.4 878.2 2018 95.6 45.2 155.0 69.8 47.4 17.2 44.2 76.0 66.6 61.4 181.8 149.4 1009.6 2019 41.8 58.2 75.8 81.6 24.6 84.4 35.0 100.2 113.6 143.4 149.4 125.8 1033.8 2020 78.6 145.4 51.8 30.6 9.6 129.2 34.4 114.4 34.8 151.6 64.2 128.8 973.4 2021 118.2 80.2 45.4 16.4 158.4 60.8 113.4 62.6 88.6 228.4 38.4 121.4 1132.2 2022 43.0 77.6 85.4 17.4 57.8 64.0 10.4 20.0 95.2 158.2 255.6 146.0 1030.6 2023 120.8 13.8 199.8 95.2 66.4 24.8 150.8 112.4 146.6 141.2 136.4 206.2 1414.4 2024 68.6 224.2 158.2 92.8 131.8 16.4 91.2 32.0 163.8 205.6 101.4 74.4 1360.4 2025 168.4 86.2 7.6 93.8 20.6 56.4 32.8 44.8 119.2 85.4 156.0 201.6 819.6 2026 Min 41.8 0.0 7.6 16.4 9.6 16.4 10.4 20.0 8.6 41.2 38.4 29.4 626.8 Ave 96.6 86.4 85.4 55.6 65.6 58.2 60.7 82.0 83.5 121.7 118.8 122.4 1033.3 Max 206.8 224.2 199.8 95.2 158.4 129.2 150.8 205.4 163.8 228.4 255.6 206.2 1414.4 WordPress Data Table 01 Local Airspace Our local airspace rules Read more 02 Glide and Seek See where our Gliders are today! Read more 03 Visiting Pilots Information for Visiting Pilots Read more 04 Junior Gliding Are you Under 21? Read more here! Read more 05 Prices Membership and Activity Pricing Read more